Did you know that:
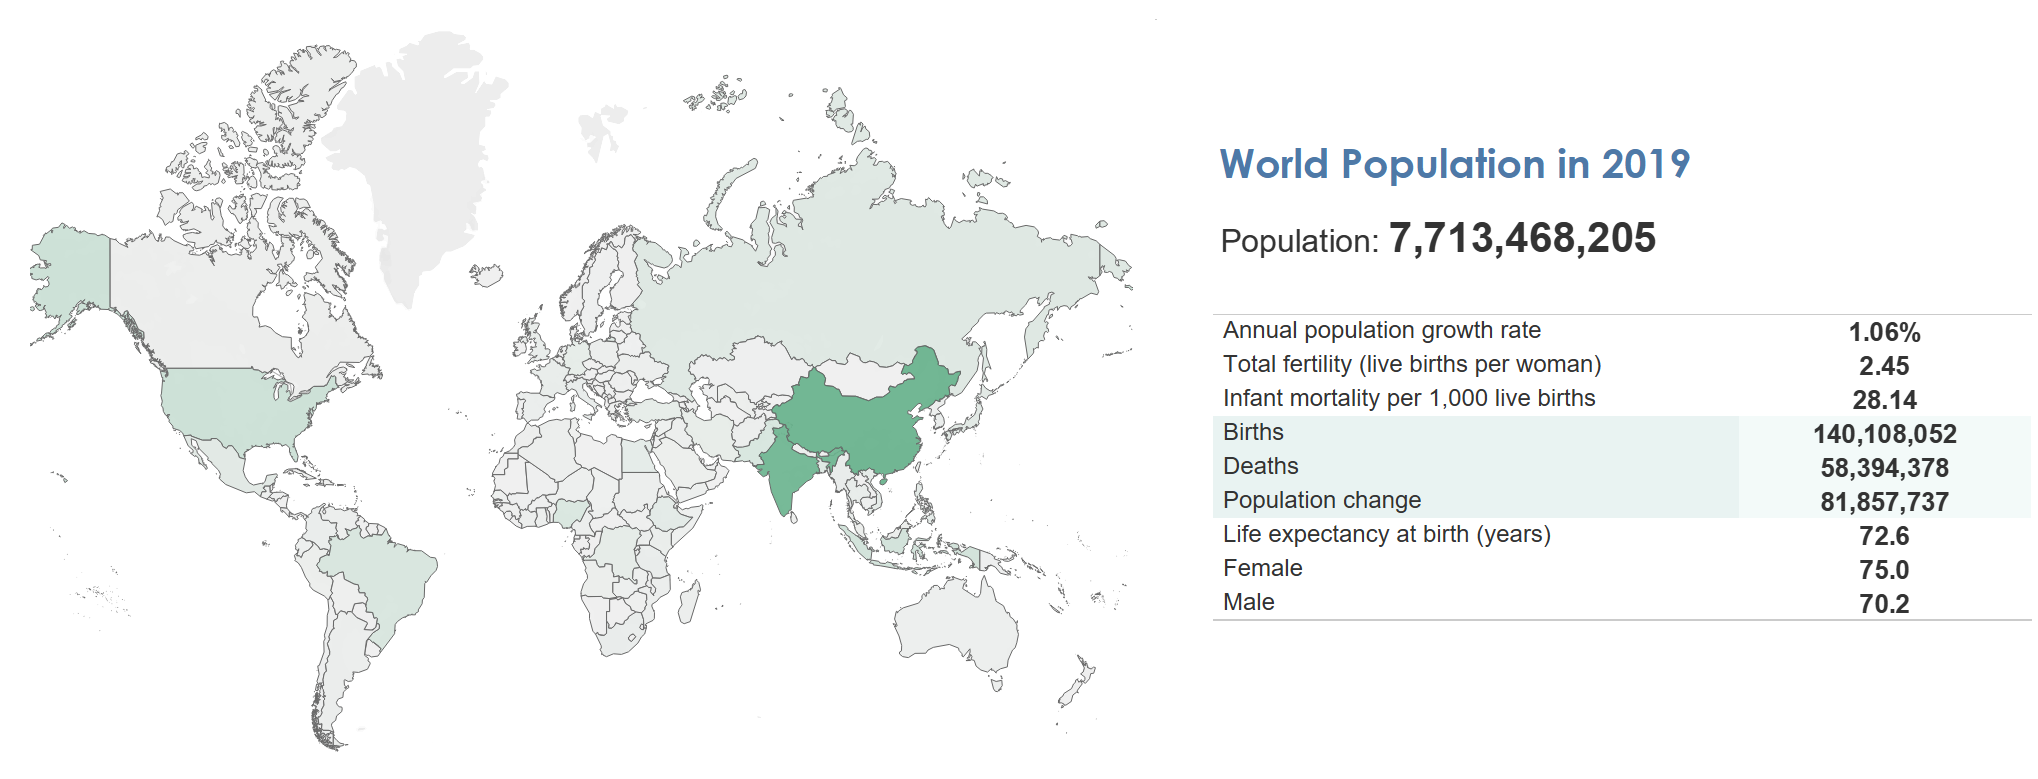
- India’s population is projected to overtake China’s in 2027?

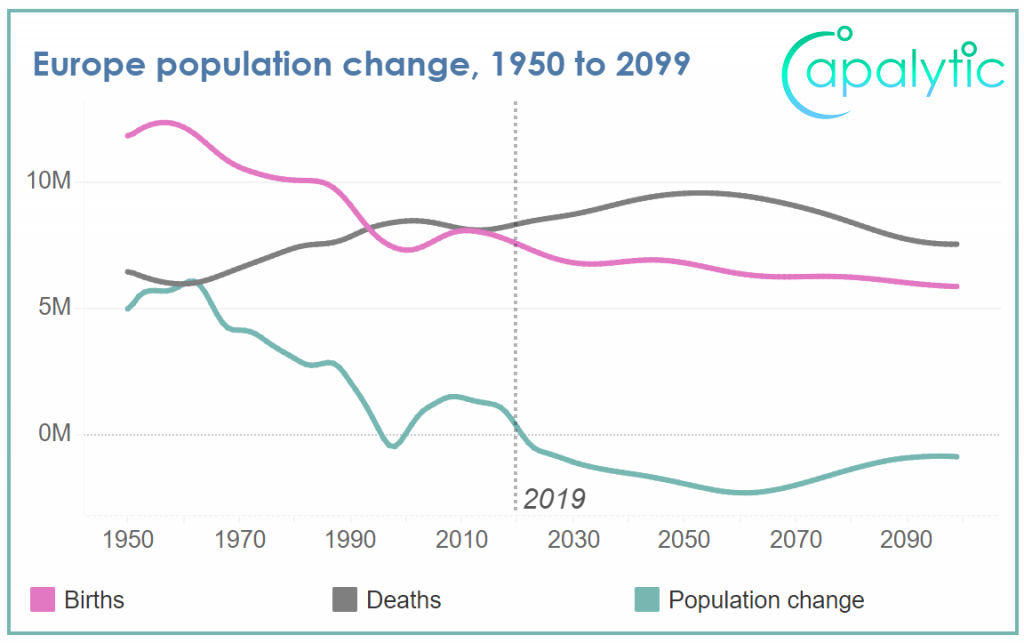
- The population of Europe is expected to peak in 2021, as declining birth rates and increasing death rates limit population growth?
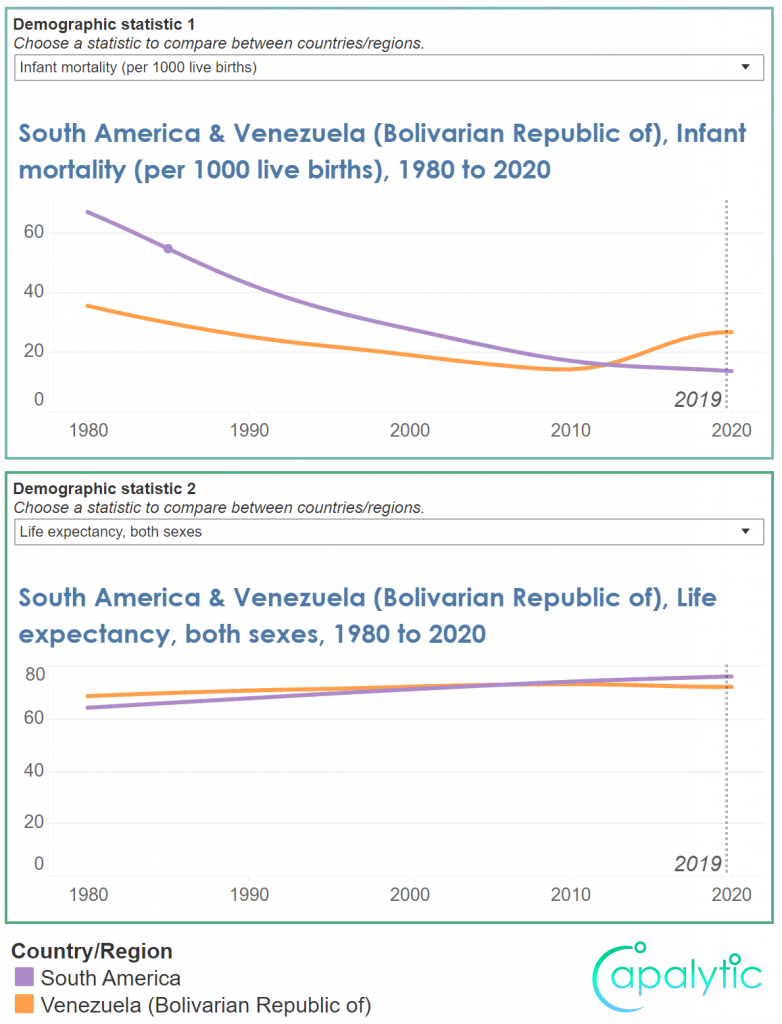
- While infant mortality is falling and life expectancy is increasing in South America, in Venezuela the reverse has been the case since 2011 due to the ongoing economic and political crisis?
These findings and others are derived from Capalytic’s visualisation of the UN Population Projections 2019 data set, created in Tableau by lead consultant Tom Ling. Capalytic is now offering data visualisation in Tableau as part of our data analysis contract services.
To view the visualisation at the Capalytic website, click here.
For more information, or to discuss opportunities and rates, visit the Capalytic website today or contact Tom Ling at tom@capalytic.com.
About Capalytic
Capalytic Limited was established in May 2019 to provide freelance and contract services in market research, data analysis and consulting. We believe in enhancing capability through analytics – ensuring that your business or organisation benefits from the insights that data provides.